1. Overview
In this tutorial, we’ll examine Java Flight Recorder, its concepts, its basic commands, and how to use it.
2. Java Monitoring Utilities
Java is not just a programming language but a very rich ecosystem with a lot of tools. The JDK contains programs that allow us to compile our own programs, as well as monitor their state and the state of the Java Virtual Machine during the full life cycle of program execution.
The bin folder of a JDK distribution contains, among others, the following programs that can be used for profiling and monitoring:
- Java VisualVM (jvisualvm.exe)
- JConsole (jconsole.exe)
- Java Mission Control (jmc.exe)
- Diagnostic Command Tool (jcmd.exe)
We suggest exploring the content of this folder to be aware of what tools we have at our disposal.
In this tutorial, we’ll focus on the Java Flight Recorder. This isn’t present among the tools mentioned above because it isn’t a standalone program. Its usage is closely related to two of the tools above — Java Mission Control and Diagnostic Command Tools.
3. Java Flight Recorder and Its Basic Concepts
Java Flight Recorder (JFR) is a monitoring tool that collects information about the events in a Java Virtual Machine (JVM) during the execution of a Java application. JFR is part of the JDK distribution, and it’s integrated into the JVM.
JFR is designed to affect the performance of a running application as little as possible.
In order to use JFR, we should activate it. We may achieve this in two ways:
- when starting a Java application
- passing diagnostic commands of the jcmd tool when a Java application is already running
JFR doesn’t have a standalone tool. We use Java Mission Control (JMC), which contains a plugin that allows us to visualize the data collected by JFR.
These three components — JFR, jcmd and JMC — form a complete suite for collecting low-level runtime information of a running Java program. We may find this information very useful when optimizing our program, or when diagnosing it when something goes wrong.
If we have various versions of Java installed on our computer, it’s important to make sure that the Java compiler (javac), the Java launcher (java) and the above-mentioned tools (JFR, jcmd and JMC) are from the same Java distribution. Otherwise, there’s a risk of not being able to see any useful data because the JFR data formats of different versions might be not compatible.
JFR has two main concepts: events and dataflow. Let’s briefly discuss them.
3.1. Events
JFR collects events that occur in the JVM when the Java application runs. These events are related to the state of the JVM itself or the state of the program. An event has a name, a timestamp, and additional information (like thread information, execution stack, and state of the heap).
There are three types of events that JFR collects:
- an instant event is logged immediately once it occurs
- a duration event is logged if its duration succeeds a specified threshold
- a sample event is used to sample the system activity
3.2. Dataflow
The events that JFR collects contain a huge amount of data. For this reason, by design, JFR is fast enough to not impede the program.
JFR saves data about the events in a single output file, flight.jfr.
As we know, disk I/O operations are quite expensive. Therefore, JFR uses various buffers to store the collected data before flushing the blocks of data to disk. Things might become a little bit more complex because, at the same moment, a program might have multiple registering processes with different options.
Because of this, we may find more data in the output file than requested, or it may not be in chronological order. We might not even notice this fact if we use JMC, because it visualizes the events in chronological order.
In some rare cases, JFR might fail to flush the data (for example, when there are too many events or in a case of power outage). If this occurs, JFR tries to inform us that the output file might be missing a piece of data.
4. How to Use Java Flight Recorder
JFR is an experimental feature, hence its use is subject to change. In fact, in earlier distributions, we have to activate commercial features in order to use it in production. However, starting from JDK 11, we may use it without activating anything. We can always consult the official Java release notes to check how to use this tool.
For JDK 8, to be able to activate JFR, we should start the JVM with the options +UnlockCommercialFeatures and +FlightRecorder.
As we’ve mentioned above, there are two ways to activate JFR. When we activate it simultaneously with starting the application, we do it from the command line. When the application is already running, we use the diagnostic command tool.
4.1. Command Line
First, we compile the program’s *.java file into a *.class using the standard java compiler javac.
Once the compilation succeeds, we may start the program with the following options:
java -XX:+UnlockCommercialFeatures -XX:+FlightRecorder
  -XX:StartFlightRecording=duration=200s,filename=flight.jfr path-to-class-file
where path-to-class-file is the application’s entry point *.class file.
This command launches the application and activates the recording, which starts immediately and lasts no more than 200 seconds. Collected data is saved in an output file, flight.jfr. We’ll describe the other options in more detail in the next section.
4.2. Diagnostic Command Tool
We can also start registering the events by using the jcmd tool. For example:
jcmd 1234 JFR.start duration=100s filename=flight.jfr
Prior to JDK 11, in order to be able to activate JFR in this way, we should start the application with unlocked commercial features:
java -XX:+UnlockCommercialFeatures -XX:+FlightRecorder -cp ./out/ com.baeldung.Main
Once the application is running, we use its process id in order to execute various commands, which take the following format:
jcmd <pid|MainClass> <command> [parameters]
Here’s a complete list of the diagnostic commands:
- JFR.start – starts a new JFR recording
- JFR.check – checks running JFR recording(s)
- JFR.stop – stops a specific JFR recording
- JFR.dump – copies contents of a JFR recording to file
Each command has a series of parameters. For example, the JFR.start command has the following parameters:
- name – name of the recording; it serves to be able to reference this recording later with other commands
- delay – dimensional parameter for a time delay of recording start, the default value is 0s
- duration – dimensional parameter for a time interval of the duration of the recording; the default value is 0s, which means unlimited
- filename – name of a file that contains the collected data
- maxage – dimensional parameter for the maximum age of collected data; the default value is 0s, which means unlimited
- maxsize – maximum size of buffers for collected data in bytes; the default value is 0, which means no max size
We’ve already seen an example of the usage of these parameters at the beginning of this section. For the complete list of the parameters, we may always consult the Java Flight Recorded official documentation.
Although JFR is designed to have as little of a footprint as possible on the performance of the JVM and the application, it’s better to limit the maximum amount of collected data by setting at least one of the parameters: duration, maxage, or maxsize.
5. Java Flight Recorder in Action
Let’s now demonstrate JFR in action by using an example program.
5.1. Example Program
Our program inserts objects into a list until an OutOfMemoryError occurs. Then the program sleeps for one second:
public static void main(String[] args) {
    List<Object> items = new ArrayList<>(1);
    try {
        while (true){
            items.add(new Object());
        }
    } catch (OutOfMemoryError e){
        System.out.println(e.getMessage());
    }
    assert items.size() > 0;
    try {
        Thread.sleep(1000);
    } catch (InterruptedException e) {
        System.out.println(e.getMessage());
    }
}
Without executing this code, we can spot a potential drawback: the while loop will lead to high CPU and memory usage. Let’s use JFR to see these drawbacks and probably find others.
5.2. Start Registering
First, we compile our program by executing the following command from the command line:
javac -d out -sourcepath src/main src/main/com/baeldung/flightrecorder/FlightRecorder.java
At this point, we should find a file FlightRecorder.class in the out/com/baeldung/flightrecorder directory.
Now, we’ll start the program with the following options:
java -XX:+UnlockCommercialFeatures -XX:+FlightRecorder
  -XX:StartFlightRecording=duration=200s,filename=flight.jfr
  -cp ./out/ com.baeldung.flightrecorder.FlightRecorder
5.3. Visualize Data
Now, we feed the file flight.jfr to Java Mission Control, which is part of the JDK distribution. It helps us visualize the data about our events in a nice and intuitive way.
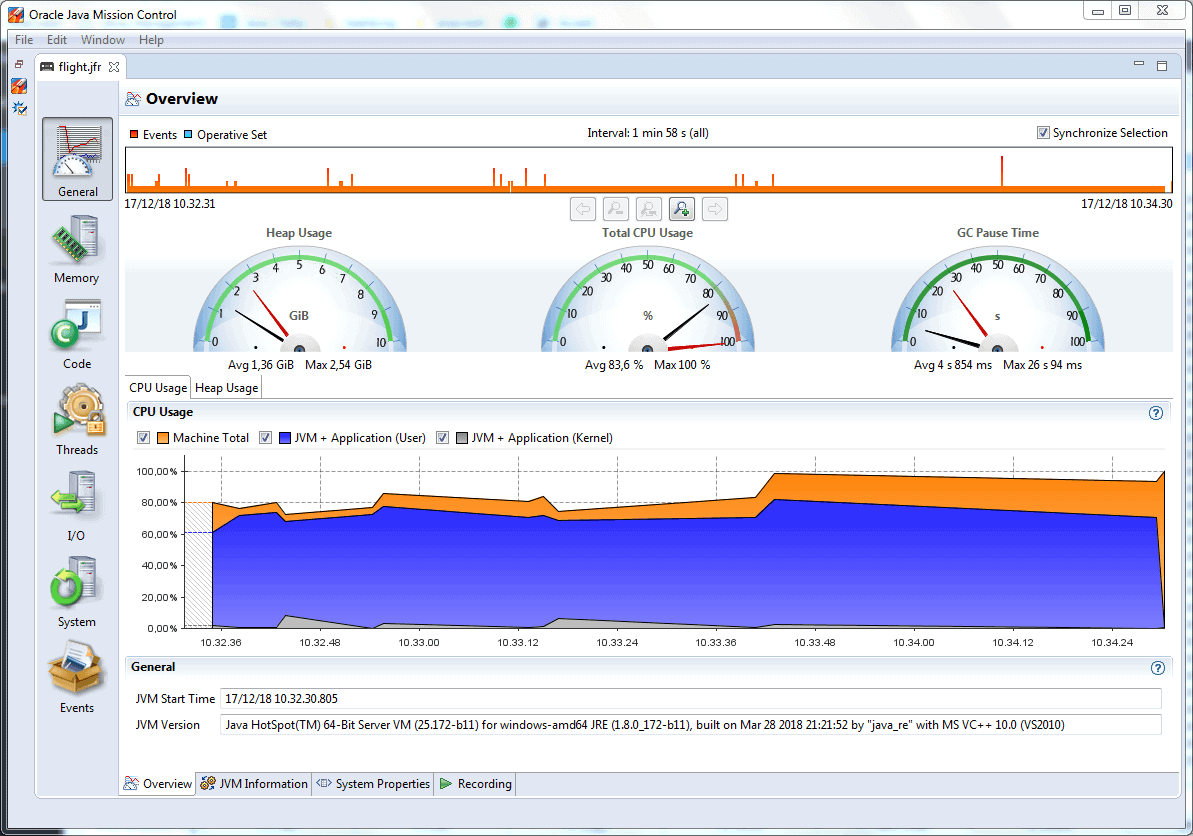
Its main screen shows us the information about how the program was using the CPU during its execution. We see that the CPU was loaded heavily, which is quite expected due to the while loop:
Image may be NSFW.Clik here to view.

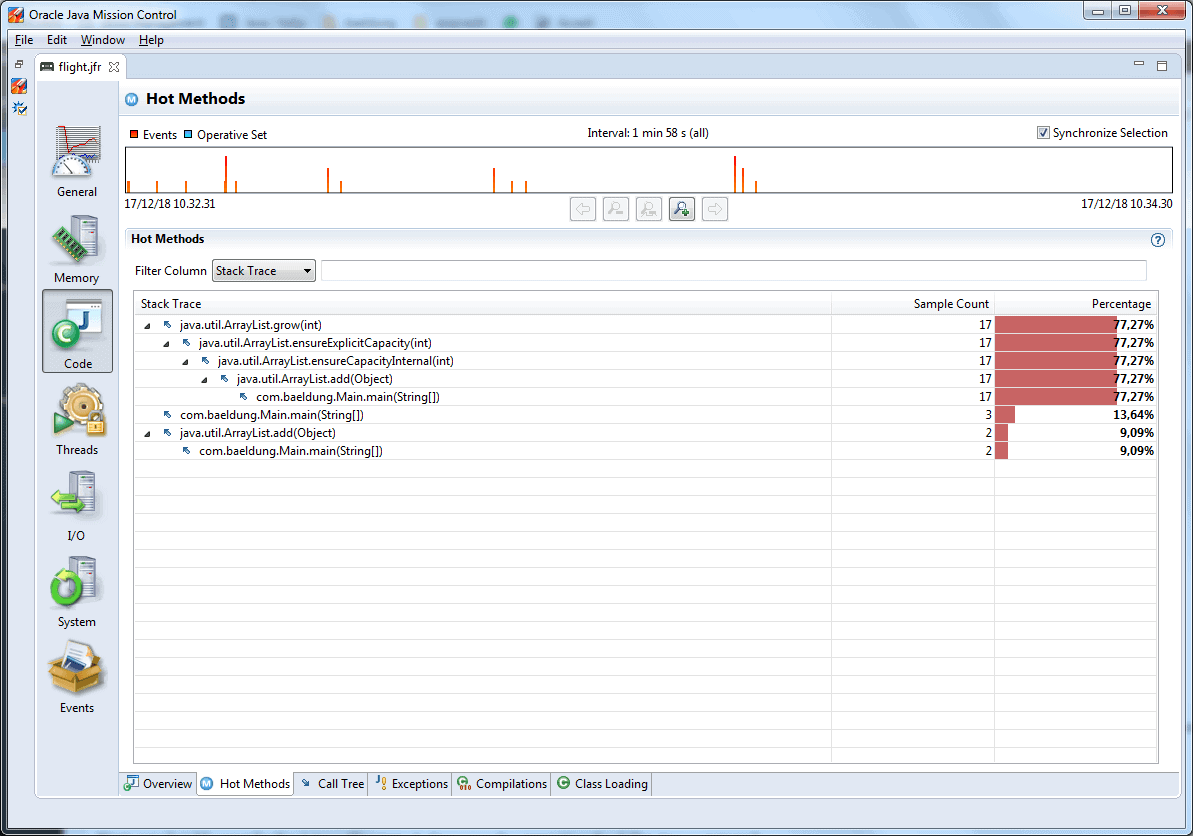
On the left side of the view, we see sections General, Memory, Code, and Threads, among others. Each section contains various tabs with detailed information. For example, tab Hot Methods of section Code contains the statistics of method calls:
Image may be NSFW.Clik here to view.

In this tab, we can spot another drawback of our example program: method java.util.ArrayList.grow(int) has been called 17 times in order to enlarge the array capacity every time there wasn’t enough space for adding an object.
In more realistic programs, we may see a lot of other useful information:
- statistics about created objects, when they were created and destroyed by the garbage collector
- a detailed report about the threads’ chronology, when they were locked or active
- which I/O operations the application was executing
6. Conclusion
In this article, we introduced the topic of monitoring and profiling a Java application using Java Flight Recorder. This tool remains an experimental one, so we should consult its official site for more complete and recent information.
As always, the code snippet is available over on our Github repository.
Image may be NSFW.Clik here to view.