1. Introduction
Today, it’s not uncommon for applications to serve thousands or even millions of users concurrently. Such applications need enormous amounts of memory. However, managing all that memory may easily impact application performance.
To address this issue, Java 11 introduced the Z Garbage Collector (ZGC) as an experimental garbage collector (GC) implementation.
In this tutorial, we’ll see how ZGC manages to keep low pause times on even multi-terabyte heaps.
2. Main Concepts
In order to understand ZGC, we need to understand the basic concepts and terminology behind memory management and garbage collectors.
2.1. Memory Management
Physical memory is the RAM that our hardware provides.
The operating system (OS) allocates virtual memory space for each application.
Of course, we store virtual memory in physical memory, and the OS is responsible for maintaining the mapping between the two. This mapping usually involves hardware acceleration.
2.2. Garbage Collection
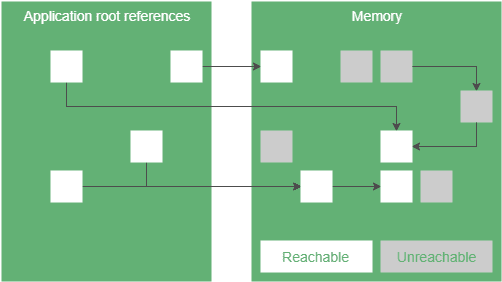
When we create a Java application, we don’t have to free the memory we allocated, because garbage collectors do it for us. In summary, GC watches which objects can we reach from our application through a chain of references and frees up the ones we can’t reach.
To achieve it, garbage collectors have multiple phases.
2.3. GC Phase Properties
GC phases can have different properties:
- a parallel phase can run on multiple GC threads
- a serial phase runs on a single thread
- a stop the world phase can’t run concurrently with application code
- a concurrent phase can run in the background, while our application does its work
- an incremental phase can terminate before finishing all of its work and continue it later
Note, that all of the above techniques have their strengths and weaknesses. For example, let’s say we have a phase which can run concurrently with our application. A serial implementation of this phase requires 1% of the overall CPU performance and runs for 1000ms. In contrast, a parallel implementation utilizes 30% of CPU and completes its work in 50ms.
In this example, the parallel solution uses more CPU overall, because it may be more complex and have to synchronize the threads. For CPU heave applications (for example batch jobs) it’s a problem since we have less computing power to do effective work.
Of course, this example has made-up numbers. However, it’s clear that all applications have their own characteristics, so they have different GC requirements.
For more detailed descriptions, please visit our article on Java memory management.
3. ZGC Concepts
On top of tried and tested GC techniques, ZGC introduces two new concepts: pointer coloring and load barriers.
3.1. Pointer Coloring
A pointer represents the position of a byte in the virtual memory. However, we don’t necessarily have to use all bits of a pointer to do that – some bits can represent properties of the pointer. That’s what we call pointer coloring.
With 32 bits, we can address 4 gigabytes. Since nowadays it’s very common for a configuration to have more memory than this, we obviously can’t use any of these 32 bits for coloring. Therefore, ZGC uses 64-bit pointers. This means ZGC is only available on 64-bit platforms:

ZGC pointers use 42 bits to represent the address itself. As a result, ZGC pointers can address 4 terabytes of memory space.
On top of that, we have 4 bits to store pointer states:
- finalizable bit – the object is only reachable through a finalizer
- remap bit – the reference points to the current address of the object (see relocation)
- marked0 and marked1 bits – these are used to flag reachable objects
We also called these bits metadata bits. In ZGC, exactly one of these metadata bits is 1.
3.2. Multi-Mapping
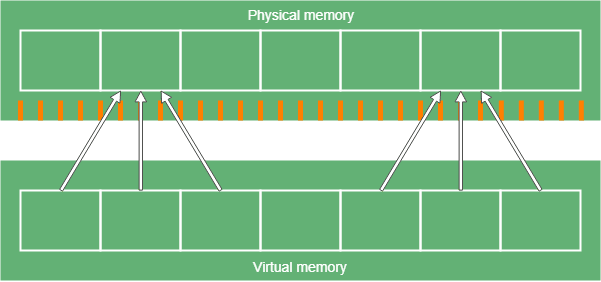
Multi-mapping means that we map multiple ranges of virtual memory to the physical memory. In ZGC, these ranges only differ in the previously mentioned metadata bits.
Note that pointer coloring makes dereferencing more expensive since we have to mask the useful bits to access the address itself. However, ZGC bypasses this cost with the fact that exactly one of the four metadata bits will be 1. This way we only have four ranges to map, and the mapping is handled by the operating system. Furthermore, we only use three of these ranges, since we never want to dereference a finalizable pointer:

3.3. Load Barriers
A load barrier is a piece of code that runs when a thread loads a reference from a heap – for example, when we access a non-primitive field of an object.
In ZGC, load barriers check the metadata bits of the reference. Depending on these bits, ZGC may perform some processing on the reference before we get it. Therefore, it might produce an entirely different reference.
3.4. Marking
Marking is the process when the garbage collector determines which objects we can reach. The ones we can’t reach are considered garbage. ZGC breaks marking to three phases:

The first phase is a stop the world phase. In this phase, we look for root references and mark them. Root references are the starting points to reach objects in the heap, for example, local variables or static fields. Since the number of root references is usually small, this phase is short.
The next phase is a concurrent phase. In this phase, we traverse the object graph, starting from the root references. We mark every object we reach. Also, when a load barrier detects an unmarked reference, it marks it too.
The last phase is also a stop the world phase to handle some edge cases, like weak references.
At this point, we know which objects we can reach.
ZGC uses the marked0 and marked1 metadata bits for marking.
3.5. Relocation
We can follow two strategies when we have to allocate memory to new objects.
First, we can scan the memory for free space that’s big enough to hold our object. Scanning the memory is an expensive operation. In addition, the memory will be fragmented, since there’ll be gaps between the objects. If we want to minimize these gaps, it uses even more processing power.
The other strategy is to frequently relocate objects from fragmented memory areas to free areas in a more compact format. To be more effective, we split the memory space into blocks. We relocate all objects in a block or none of them. This way memory allocation will be faster since we know there are whole empty blocks in the memory.
In ZGC, relocation also consists of three phases.
- A concurrent phase looks for blocks we want to relocate and puts them in the relocation set.
- A stop the world phase relocates all root references in the relocation set and updates their references.
- A concurrent phase relocates all remaining objects in the relocation set and stores the mapping between the old and new addresses in the forward table.
3.6. Remapping
Note that in the relocation phase, we didn’t rewrite all references to relocated objects. Therefore, using those references, we wouldn’t access the objects we wanted to. Even worse, we could access garbage.
ZGC uses the load barriers to solve this issue. Load barriers fix the references pointing to relocated objects with a technique called remapping.
The following diagram shows how remapping works:

4. How to Enable ZGC?
We can enable ZGC with the following command line options when running our application:
-XX:+UnlockExperimentalVMOptions -XX:+UseZGC
Note that since ZGC is an experimental GC, it’ll take some time to become officially supported.
5. Conclusion
In this article, we saw that ZGC intends to support large heap sizes with low application pause times.
To reach this goal, it uses techniques including colored 64-bit pointers, load barriers, relocation, and remapping.


