1. Introduction
In this tutorial, we're going to look at ways we can change the logging level of a Spring Boot application at runtime. As with many things, Spring Boot has built-in logging functionality that configures it for us. We're going to explore how to adjust the logging levels of a running application.
We'll look at three ways of doing that: using the Spring Boot Actuator loggers endpoint, the auto-scan functionality in Logback and finally using the Spring Boot Admin tool.
2. Spring Boot Actuator
We're going to start by using the /loggers Actuator endpoint to display and change our logging level. The /loggers endpoint is available at actuator/loggers and we can access a specific logger by appending its name as part of the path.
For example, we can access the root logger with the URL http://localhost:8080/actuator/loggers/root.
2.1. Setup
Let's start by setting up our application to use the Spring Boot Actuator.
First, we need to add the Spring Boot Actuator Maven dependency to our pom.xml file:
<dependency>
    <groupId>org.springframework.boot</groupId>
    <artifactId>spring-boot-starter-actuator</artifactId>
    <version>2.1.8.RELEASE</version>
</dependency>
Starting with Spring Boot 2.x, most endpoints are disabled by default, so we'll also need to enable the /loggers endpoint in our application.properties file:
management.endpoints.web.exposure.include=loggers
management.endpoint.loggers.enabled=true
Lastly, let's create a controller with a series of logging statements so that we can see the effects of our experiments:
@RestController
@RequestMapping("/log")
public class LoggingController {
    private Log log = LogFactory.getLog(LoggingController.class);

    @GetMapping
    public String log() {
        log.trace("This is a TRACE level message");
        log.debug("This is a DEBUG level message");
        log.info("This is an INFO level message");
        log.warn("This is a WARN level message");
        log.error("This is an ERROR level message");
        return "See the log for details";
    }
}
2.2. Using the /loggers Endpoint
Let's start our application and access our log API:
curl http://localhost:8080/log
Then, let's check the logs where we should find three logging statements:
2019-09-02 09:51:53.498  INFO 12208 --- [nio-8080-exec-1] c.b.s.b.m.logging.LoggingController      : This is an INFO level message
2019-09-02 09:51:53.498  WARN 12208 --- [nio-8080-exec-1] c.b.s.b.m.logging.LoggingController      : This is a WARN level message
2019-09-02 09:51:53.498 ERROR 12208 --- [nio-8080-exec-1] c.b.s.b.m.logging.LoggingController      : This is an ERROR level message
Now, let's call the /loggers Actuator endpoint to check on the logging level for our com.baeldung.spring.boot.management.logging package:
curl http://localhost:8080/actuator/loggers/com.baeldung.spring.boot.management.logging
  {"configuredLevel":null,"effectiveLevel":"INFO"}
To change the logging level, we can issue a POST request to the /loggers endpoint:
curl -i -X POST -H 'Content-Type: application/json' -d '{"configuredLevel": "TRACE"}'
  http://localhost:8080/actuator/loggers/com.baeldung.spring.boot.management.logging
  HTTP/1.1 204
  Date: Mon, 02 Sep 2019 13:56:52 GMT
If we check the logging level again, we should see it set to TRACE:
curl http://localhost:8080/actuator/loggers/com.baeldung.spring.boot.management.logging
  {"configuredLevel":"TRACE","effectiveLevel":"TRACE"}
Finally, we can re-run our log API and see our changes in action:
curl http://localhost:8080/log
Now, let's check the logs again:
2019-09-02 09:59:20.283 TRACE 12208 --- [io-8080-exec-10] c.b.s.b.m.logging.LoggingController      : This is a TRACE level message
2019-09-02 09:59:20.283 DEBUG 12208 --- [io-8080-exec-10] c.b.s.b.m.logging.LoggingController      : This is a DEBUG level message
2019-09-02 09:59:20.283  INFO 12208 --- [io-8080-exec-10] c.b.s.b.m.logging.LoggingController      : This is an INFO level message
2019-09-02 09:59:20.283  WARN 12208 --- [io-8080-exec-10] c.b.s.b.m.logging.LoggingController      : This is a WARN level message
2019-09-02 09:59:20.283 ERROR 12208 --- [io-8080-exec-10] c.b.s.b.m.logging.LoggingController      : This is an ERROR level message
3. Logback Auto-scan
By default, our Spring Boot applications are using the Logback logging library. Let's now look at how we can take advantage of Logback's auto-scan feature to change our logging level.
First, let's add some Logback configuration by placing a file named logback.xml under our src/main/resources directory:
<configuration scan="true" scanPeriod="15 seconds">
    <appender name="STDOUT" class="ch.qos.logback.core.ConsoleAppender">
        <encoder>
            <pattern>%d{HH:mm:ss.SSS} [%thread] %-5level %logger{36} - %msg%n</pattern>
        </encoder>
    </appender>

    <logger name="com.baeldung.spring.boot.management.logging" level="INFO" />

    <root level="info">
        <appender-ref ref="STDOUT" />
    </root>
</configuration>
The key detail is in the first line of the logback.xml file. By setting the scan attribute to true, we're telling Logback to check the configuration file for changes. The auto-scan happens every 60 seconds by default.
Setting the scanPeriod to 15 seconds tells it to reload every 15 seconds so we don't have to wait around as long during our experiments.
Let's try it out by starting the application and calling our log API again:
curl http://localhost:8080/log
Our output should reflect the INFO logging level for our package:
10:21:13.167 [http-nio-8080-exec-1] INFO  c.b.s.b.m.logging.LoggingController - This is an INFO level message
10:21:13.167 [http-nio-8080-exec-1] WARN  c.b.s.b.m.logging.LoggingController - This is a WARN level message
10:21:13.168 [http-nio-8080-exec-1] ERROR c.b.s.b.m.logging.LoggingController - This is an ERROR level message
Now, let's modify our com.baeldung.spring.boot.management.logging logger in logback.xml to TRACE:
<logger name="com.baeldung.spring.boot.management.logging" level="TRACE" />
After giving it 15 seconds, let's rerun the log API at http://localhost:8080/log and check our log output:
10:24:18.429 [http-nio-8080-exec-2] TRACE c.b.s.b.m.logging.LoggingController - This is a TRACE level message
10:24:18.430 [http-nio-8080-exec-2] DEBUG c.b.s.b.m.logging.LoggingController - This is a DEBUG level message
10:24:18.430 [http-nio-8080-exec-2] INFO  c.b.s.b.m.logging.LoggingController - This is an INFO level message
10:24:18.430 [http-nio-8080-exec-2] WARN  c.b.s.b.m.logging.LoggingController - This is a WARN level message
10:24:18.430 [http-nio-8080-exec-2] ERROR c.b.s.b.m.logging.LoggingController - This is an ERROR level message
4. Spring Boot Admin
The third way we're going to change our logging level is through the Spring Boot Admin tool. To use the Spring Boot Admin, we need to create a server application and configure our application as a client.
4.1. The Admin Application
To change our logging level with Spring Boot Admin, we'll need to set up a new application to use as our admin server. We can use the Spring Initialzr for that.
Let's add the latest spring-boot-admin-starter-server to our pom.xml:
<dependency>
    <groupId>de.codecentric</groupId>
    <artifactId>spring-boot-admin-starter-server</artifactId>
    <version>2.1.6</version>
</dependency>
For detailed instructions on setting up an Admin Server, please see Section 2 in our Guide to Spring Boot Admin. Also, Section 4 includes the information necessary to set up security since we'll be securing our client.
4.2. Client Configuration
Once we have an Admin Server, we need to set our application up as a client.
First, let's add a Maven dependency for spring-boot-admin-starter-client:
<dependency>
    <groupId>de.codecentric</groupId>
    <artifactId>spring-boot-admin-starter-client</artifactId>
    <version>2.1.6</version>
</dependency>
We'll also want security between our admin server and the client, so let's bring in the Spring Boot Security starter:
<dependency>
    <groupId>org.springframework.boot</groupId>
    <artifactId>spring-boot-starter-security</artifactId>
    <version>2.1.8.RELEASE</version>
</dependency>
Next, we need to make some configuration changes in our application.properties files.
The admin server is running on port 8080, so let's start by changing our port and giving the application a name:
spring.application.name=spring-boot-management
server.port=8081
Now, let's add the configuration we need to access the server:
spring.security.user.name=client
spring.security.user.password=client

spring.boot.admin.client.url=http://localhost:8080
spring.boot.admin.client.username=admin
spring.boot.admin.client.password=admin

spring.boot.admin.client.instance.metadata.user.name=${spring.security.user.name}
spring.boot.admin.client.instance.metadata.user.password=${spring.security.user.password}
This includes the URL that the admin server is running on and login information for both the client and the admin server.
Lastly, we need to enable the /health, /info and /metrics actuator endpoints for the admin server to be able to determine the client's status:
management.endpoints.web.exposure.include=httptrace,loggers,health,info,metrics
Because changing logger levels is a POST operation, we also need to add a little security configuration to ignore the CSRF protection for the actuator endpoints:
@Override
protected void configure(HttpSecurity http) throws Exception {
    http.csrf().ignoringAntMatchers("/actuator/**");
}
4.3. Using Spring Boot Admin
With the configuration out of the way, let's start both the client and the server application using mvn spring-boot:run.
Let's start by accessing our log API at http://localhost:8081/log without changing anything. We have security enabled now, so we'll be asked to log in using the credentials we specified in application.properties.
Our log output should show logging messages that reflect our INFO logging level:
09:13:23.416 [http-nio-8081-exec-10] INFO  c.b.s.b.m.logging.LoggingController - This is an INFO level message
09:13:23.416 [http-nio-8081-exec-10] WARN  c.b.s.b.m.logging.LoggingController - This is a WARN level message
09:13:23.416 [http-nio-8081-exec-10] ERROR c.b.s.b.m.logging.LoggingController - This is an ERROR level message
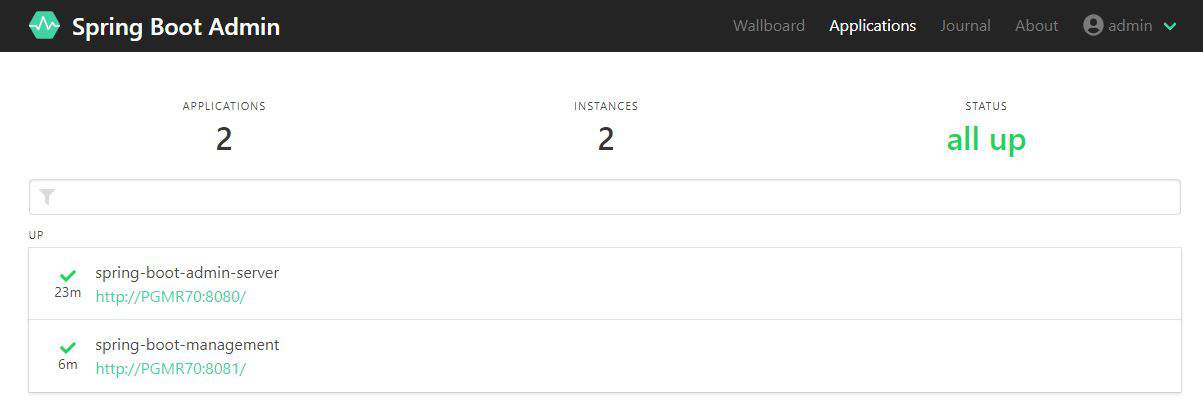
Now, let's log into the Spring Boot Admin server and change our logging level. Let's go to http://localhost:8080 and log in with the admin credentials. We'll be taken to the list of registered applications where we should see our spring-boot-management application:
Image may be NSFW.Clik here to view.

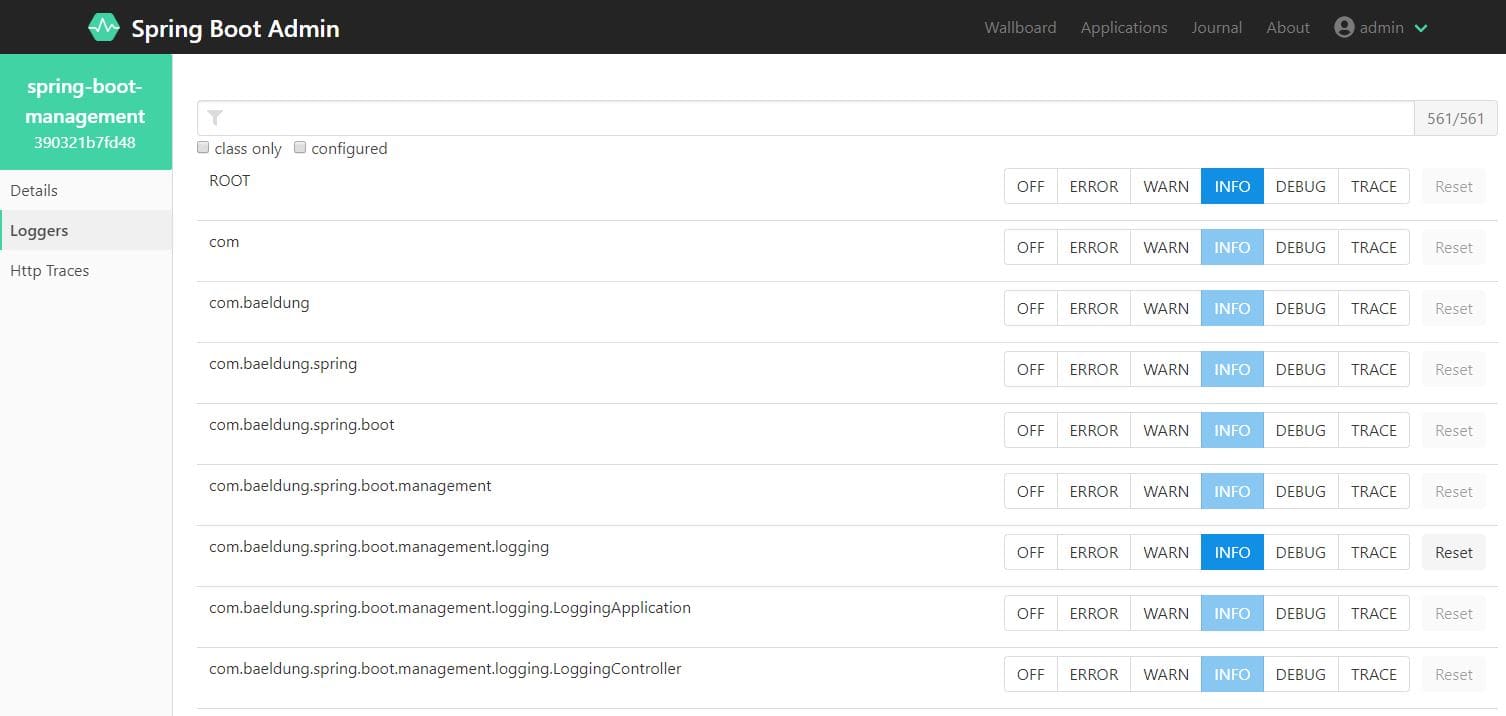
Let's select spring-boot-management and view the Loggers using the left-hand menu:
Image may be NSFW.Clik here to view.

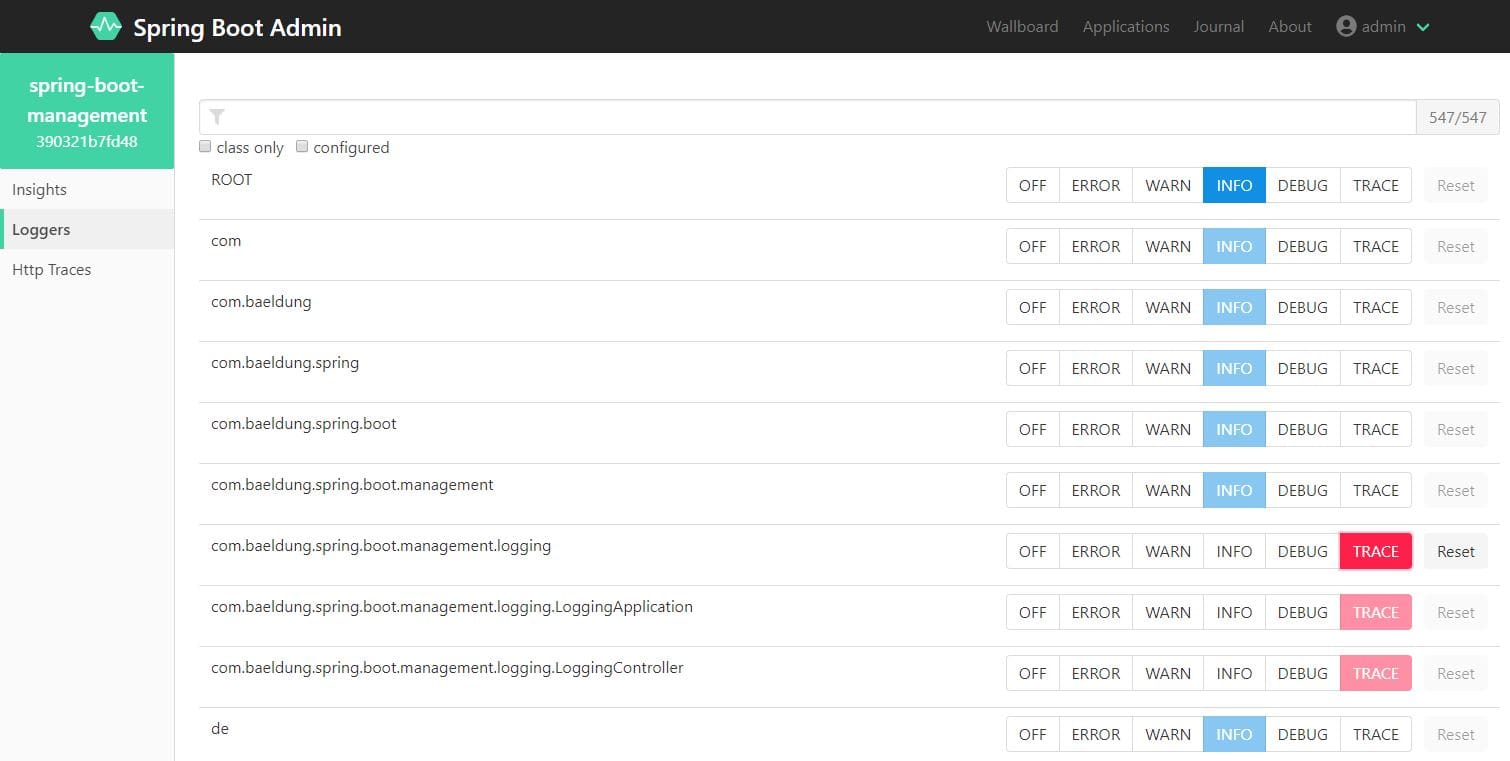
The com.baeldung.spring.boot.management.logging logger is set to INFO. Let's change it to TRACE and rerun our log API:
Image may be NSFW.Clik here to view.

Our log output should now reflect the new logger level:
10:13:56.376 [http-nio-8081-exec-4] TRACE c.b.s.b.m.logging.LoggingController - This is a TRACE level message
10:13:56.376 [http-nio-8081-exec-4] DEBUG c.b.s.b.m.logging.LoggingController - This is a DEBUG level message
10:13:56.376 [http-nio-8081-exec-4] INFO  c.b.s.b.m.logging.LoggingController - This is an INFO level message
10:13:56.376 [http-nio-8081-exec-4] WARN  c.b.s.b.m.logging.LoggingController - This is a WARN level message
10:13:56.376 [http-nio-8081-exec-4] ERROR c.b.s.b.m.logging.LoggingController - This is an ERROR level message
5. Conclusion
In this article, we explored different ways of controlling the logging level at runtime. We started out using the built-in actuators functionality. After that, we used the auto-scan feature from Logback.
Lastly, we learned how to use Spring Boot Admin to monitor and change logging levels in a registered client application.
The example code for using actuators and Logback and for setting up Spring Boot Admin are both available on GitHub.
Image may be NSFW.Clik here to view.