1. Introduction
Micrometer provides a simple facade over the instrumentation clients for a number of popular monitoring systems. Currently, it supports the following monitoring systems: Atlas, Datadog, Graphite, Ganglia, Influx, JMX and Prometheus.
In this article, we’ll introduce the basic usage of Micrometer and its integration with Spring.
For the sake of simplicity, we’ll take Micrometer Atlas as an example to demonstrate most of our use cases.
2. Maven Dependency
To start with, let’s add the following dependency to the pom.xml:
<dependency>
    <groupId>io.micrometer</groupId>
    <artifactId>micrometer-registry-atlas</artifactId>
    <version>0.12.0.RELEASE</version>
</dependency>
The latest version can be found here.
3. MeterRegistry
In Micrometer, a MeterRegistry is the core component used for registering meters. We can iterate over the registry and further each meter’s metrics, to generate a time series in the backend with combinations of metrics and their dimension values.
The simplest form of the registry is SimpleMeterRegistry. But in most cases, we should use a MeterRegistry explicitly designed for our monitoring system; for Atlas, it’s AtlasMeterRegistry.
CompositeMeterRegistry allows multiple registries to be added. It provides a solution to publish application metrics to various supported monitoring systems simultaneously.
We can add any MeterRegistry needed to upload the data to multiple platforms:
CompositeMeterRegistry compositeRegistry = new CompositeMeterRegistry();
SimpleMeterRegistry oneSimpleMeter = new SimpleMeterRegistry();
AtlasMeterRegistry atlasMeterRegistry
  = new AtlasMeterRegistry(atlasConfig, Clock.SYSTEM);

compositeRegistry.add(oneSimpleMeter);
compositeRegistry.add(atlasMeterRegistry);
There’s a static global registry support in Micrometer: Metrics.globalRegistry. Also, a set of static builders based on this global registry is provided to generate meters in Metrics:
@Test
public void givenGlobalRegistry_whenIncrementAnywhere_thenCounted() {
    class CountedObject {
        private CountedObject() {
            Metrics.counter("objects.instance").increment(1.0);
        }
    }
    Metrics.addRegistry(new SimpleMeterRegistry());

    Metrics.counter("objects.instance").increment();
    new CountedObject();

    Optional<Counter> counterOptional = Metrics.globalRegistry
      .find("objects.instance").counter();
    assertTrue(counterOptional.isPresent());
    assertTrue(counterOptional.get().count() == 2.0);
}
4. Tags and Meters
4.1. Tags
An identifier of a Meter consists of a name and tags. It is suggested that we should follow a naming convention that separates words with a dot, to help guarantee portability of metric names across multiple monitoring systems.
Counter counter = registry.counter("page.visitors", "age", "20s");
Tags can be used for slicing the metric for reasoning about the values. In the code above, page.visitors is the name of the meter, with age=20s as its tag. In this case, the counter is meant to count the visitors to the page with age between 20 and 30.
For a large system, we can append common tags to a registry, say the metrics are from a specific region:
registry.config().commonTags("region", "ua-east");
4.2. Counter
A Counter reports merely a count over a specified property of an application. We can build a custom counter with the fluent builder or the helper method of any MetricRegistry:
Counter counter = Counter
  .builder("instance")
  .description("indicates instance count of the object")
  .tags("dev", "performance")
  .register(registry);

counter.increment(2.0);

assertTrue(counter.count() == 2);

counter.increment(-1);

assertTrue(counter.count() == 2);
As seen from the snippet above, we tried to decrease the counter by one but we can only increment the counter monotonically by a fixed positive amount.
4.3. Timers
To measure latencies or frequency of events in our system, we can use Timers. A Timer will report at least the total time and events count of specific time series.
For example, we can record an application event that may last several seconds:
SimpleMeterRegistry registry = new SimpleMeterRegistry();
Timer timer = registry.timer("app.event");
timer.record(() -> {
    try {
        TimeUnit.MILLISECONDS.sleep(1500);
    } catch (InterruptedException ignored) { }
});

timer.record(3000, MILLISECONDS);

assertTrue(2 == timer.count());
assertTrue(4510 > timer.totalTime(MILLISECONDS)
  && 4500 <= timer.totalTime(MILLISECONDS));
To record a long time running events, we use LongTaskTimer:
SimpleMeterRegistry registry = new SimpleMeterRegistry();
LongTaskTimer longTaskTimer = LongTaskTimer
  .builder("3rdPartyService")
  .register(registry);

long currentTaskId = longTaskTimer.start();
try {
    TimeUnit.SECONDS.sleep(2);
} catch (InterruptedException ignored) { }
long timeElapsed = longTaskTimer.stop(currentTaskId);

assertTrue(timeElapsed / (int) 1e9 == 2);
4.4. Gauge
A gauge shows the current value of a meter.
Different to other meters, Gauges should only report data when observed. Gauges can be useful when monitoring stats of cache, collections, etc.:
SimpleMeterRegistry registry = new SimpleMeterRegistry();
List<String> list = new ArrayList<>(4);

Gauge gauge = Gauge
  .builder("cache.size", list, List::size)
  .register(registry);

assertTrue(gauge.value() == 0.0);

list.add("1");

assertTrue(gauge.value() == 1.0);
4.5. DistributionSummary
Distribution of events and a simple summary is provided by DistributionSummary:
SimpleMeterRegistry registry = new SimpleMeterRegistry();
DistributionSummary distributionSummary = DistributionSummary
  .builder("request.size")
  .baseUnit("bytes")
  .register(registry);

distributionSummary.record(3);
distributionSummary.record(4);
distributionSummary.record(5);

assertTrue(3 == distributionSummary.count());
assertTrue(12 == distributionSummary.totalAmount());
Moreover, DistributionSummary and Timers can be enriched by quantiles:
SimpleMeterRegistry registry = new SimpleMeterRegistry();
Timer timer = Timer.builder("test.timer")
  .quantiles(WindowSketchQuantiles
    .quantiles(0.3, 0.5, 0.95)
    .create())
  .register(registry);
In the snippet above, three gauges with tags quantile=0.3, quantile=0.5 and quantile=0.95 will be available in the registry, indicating the values below which 95%, 50% and 30% of observations fall, respectively.
To see these quantiles in action, let’s add the following records:
timer.record(2, TimeUnit.SECONDS);
timer.record(2, TimeUnit.SECONDS);
timer.record(3, TimeUnit.SECONDS);
timer.record(4, TimeUnit.SECONDS);
timer.record(8, TimeUnit.SECONDS);
timer.record(13, TimeUnit.SECONDS);
Then we can verify by extracting values in those three quantile Gauges:
List<Gauge> quantileGauges = registry.getMeters().stream()
  .filter(m -> m.getType().name().equals("Gauge"))
  .map(meter -> (Gauge) meter)
  .collect(Collectors.toList());

assertTrue(3 == quantileGauges.size());

Map<String, Integer> quantileMap = extractTagValueMap(registry, Type.Gauge, 1e9);
assertThat(quantileMap, allOf(
  hasEntry("quantile=0.3",2),
  hasEntry("quantile=0.5", 3),
  hasEntry("quantile=0.95", 8)));
The following four different quantile algorithms are provided out of the box: WindowSketchQuantiles, Frugal2UQuantiles, CKMSQuantiles (Cormode, Korn, Muthukrishnan, and Srivastava algorithm) and GKQuantiles (Greenwald-Khanna algorithm).
Besides, Micrometer also supports histograms:
DistributionSummary hist = DistributionSummary
  .builder("summary")
  .histogram(Histogram.linear(0, 10, 5))
  .register(registry);
Similar to quantiles, after appending several records, we can see that histogram handles the computation pretty well:
Map<String, Integer> histograms = extractTagValueMap(registry, Type.Counter, 1.0);
assertThat(histograms, allOf(
  hasEntry("bucket=0.0", 0),
  hasEntry("bucket=10.0", 2),
  hasEntry("bucket=20.0", 2),
  hasEntry("bucket=30.0", 1),
  hasEntry("bucket=40.0", 1),
  hasEntry("bucket=Infinity", 0)));
Generally, histograms can help illustrate a direct comparison in separate buckets. Histograms can also be time scaled, which is quite useful for analyzing backend service response time:
SimpleMeterRegistry registry = new SimpleMeterRegistry();
Timer timer = Timer
  .builder("timer")
  .histogram(Histogram.linearTime(TimeUnit.MILLISECONDS, 0, 200, 3))
  .register(registry);

//...
assertThat(histograms, allOf(
  hasEntry("bucket=0.0", 0),
  hasEntry("bucket=2.0E8", 1),
  hasEntry("bucket=4.0E8", 1),
  hasEntry("bucket=Infinity", 3)));
5. Binders
The Micrometer has multiple built-in binders to monitor the JVM, caches, ExecutorService and logging services.
When it comes to JVM and system monitoring, we can monitor class loader metrics (ClassLoaderMetrics), JVM memory pool (JvmMemoryMetrics) and GC metrics (JvmGcMetrics), thread and CPU utilization (JvmThreadMetrics, ProcessorMetrics).
Cache monitoring (currently, only Guava, EhCache, Hazelcast, and Caffeine are supported) is supported by instrumenting with GuavaCacheMetrics, EhCache2Metrics, HazelcastCacheMetrics, and CaffeineCacheMetrics. And to monitor log back service, we can bind LogbackMetrics to any valid registry:
new LogbackMetrics().bind(registry);
The usage of above binders are quite similar to LogbackMetrics and are all rather simple, so we won’t dive into further details here.
6. Spring Integration
Spring Boot Actuator provides dependency management and auto-configuration for Micrometer. Now it’s supported in Spring Boot 2.0/1.x and Spring Framework 5.0/4.x.
We’ll need the following dependency (the latest version can be found here):
<dependency>
    <groupId>io.micrometer</groupId>
    <artifactId>micrometer-spring-legacy</artifactId>
    <version>0.12.0.RELEASE</version>
</dependency>
Without any further change to existing code, we have enabled Spring support with the Micrometer. JVM memory metrics of our Spring application will be automatically registered in the global registry and published to the default atlas endpoint: http://localhost:7101/api/v1/publish.
There’re several configurable properties available to control metrics exporting behaviors, starting with spring.metrics.atlas.*. Check AtlasConfig to see a full list of configuration properties for Atlas publishing.
If we need to bind more metrics, only add them as @Bean to the application context.
Say we need the JvmThreadMetrics:
@Bean
JvmThreadMetrics threadMetrics(){
    return new JvmThreadMetrics();
}
As for web monitoring, it’s auto-configured for every endpoint in our application, yet manageable via a configuration property: spring.metrics.web.autoTimeServerRequests.
The default implementation provides four dimensions of metrics for endpoints: HTTP request method, HTTP response code, endpoint URI, and exception information.
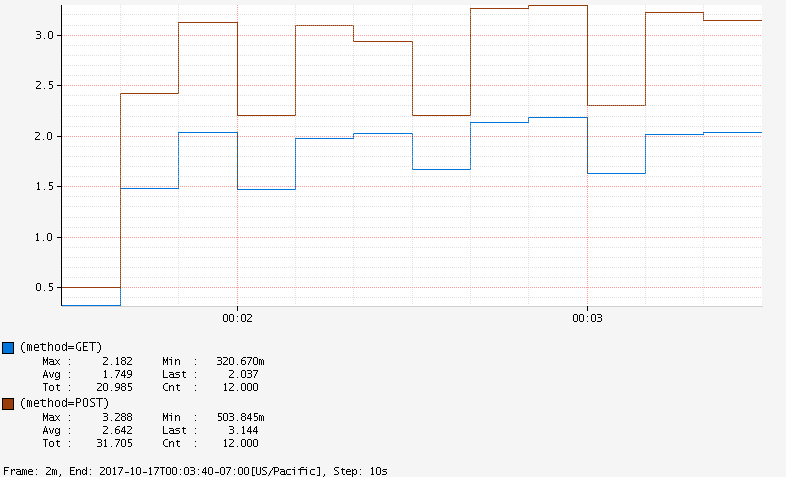
When requests are responded, metrics relating to request method (GET, POST, etc.) will be published in Atlas.
With Atlas Graph API, we can generate a graph to compare the response time for different methods:

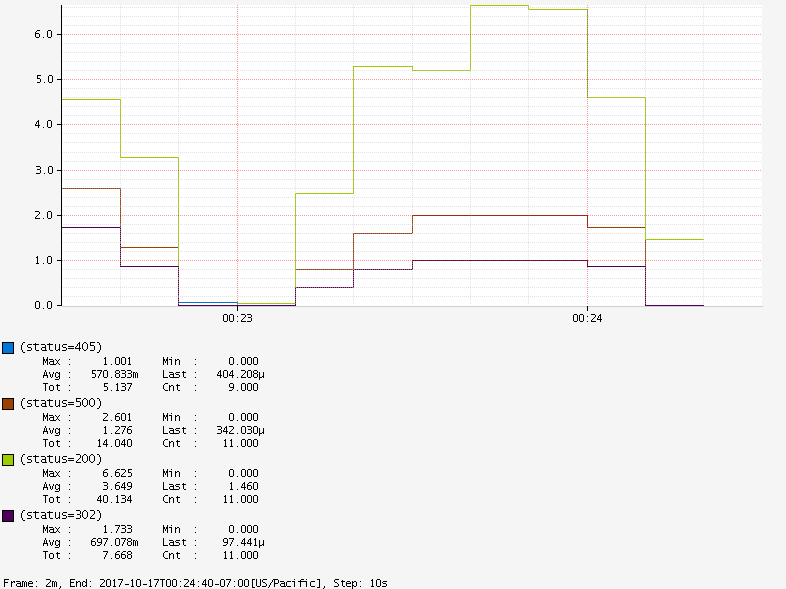
By default, response codes of 20x, 30x, 40x, 50x will also be reported:

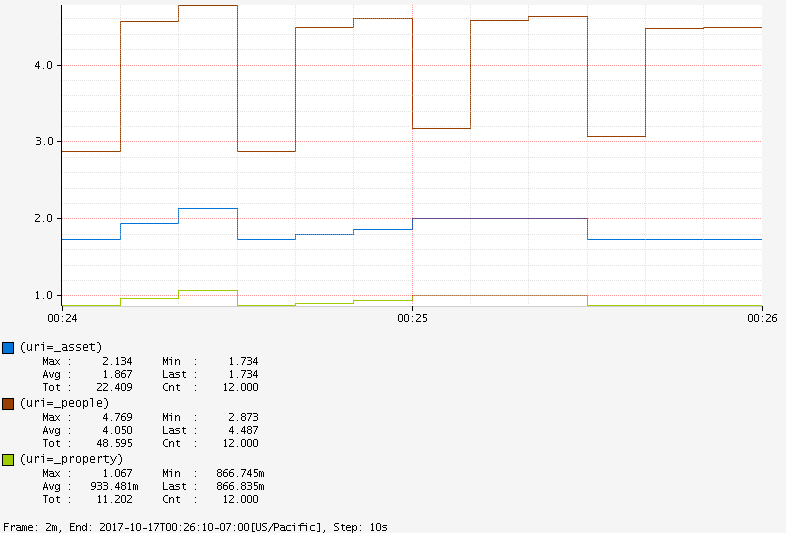
We can also compare different URIs :

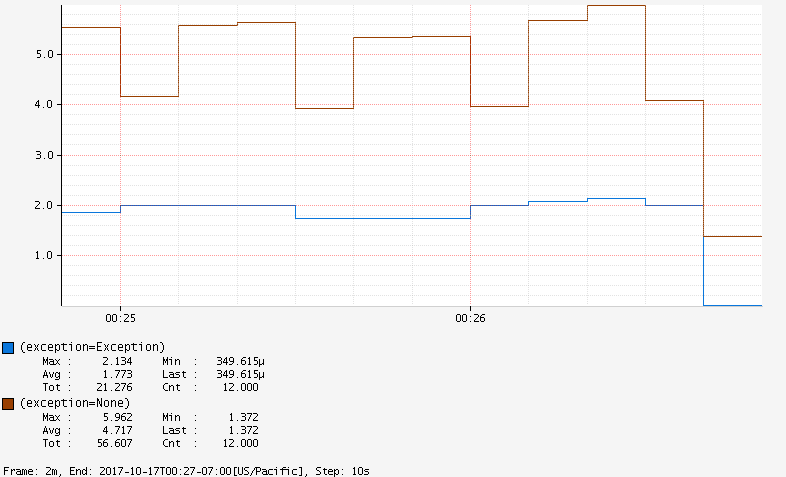
or check exception metrics:

Note that we can also use @Timed on the controller class or specific endpoint methods to customize tags, long task, quantiles, and percentiles of the metrics:
@RestController
@Timed("people")
public class PeopleController {

    @GetMapping("/people")
    @Timed(value = "people.all", longTask = true)
    public List<String> listPeople() {
        //...
    }

}
Based on the code above, we can see the following tags by checking Atlas endpoint http://localhost:7101/api/v1/tags/name:
["people", "people.all", "jvmBufferCount", ... ]
Micrometer also works in the function web framework introduced in Spring Boot 2.0. Metrics can be enabled by filtering the RouterFunction:
RouterFunctionMetrics metrics = new RouterFunctionMetrics(registry);
RouterFunctions.route(...)
  .filter(metrics.timer("server.requests"));
Metrics from the data source and scheduled tasks can also be collected. Check the official documentation for more details.
7. Conclusion
In this article, we introduced the metrics facade Micrometer. By abstracting away and supporting multiple monitoring systems under common semantics, the tool makes switching between different monitoring platforms quite easy.
As always, the full implementation code of this article can be found over on Github.