1. Introduction
Debugging is one of the most important tools for writing software.
In this tutorial, we’ll review some of the ways in which we can debug Spring applications.
We’ll also see how Spring Boot, traditional application servers, and IDEs simplify this.
2. Java Debug Args
First, let’s look at what Java gives us out of the box.
By default, the JVM does not enable debugging. This is because debugging creates additional overhead inside the JVM. It can also be a security concern for applications that are publicly accessible.
Therefore, debugging should only be performed during development and never on production systems.
Before we can attach a debugger, we must first configure the JVM to allow debugging. We do this by setting a command line argument for the JVM:
-agentlib:jdwp=transport=dt_socket,server=y,suspend=n,address=8000
Let’s break down what each of these values means:
-agentlib:jdwp
Enable the Java Debug Wire Protocol (JDWP) agent inside the JVM. This is the main command line argument that enables debugging.
transport=dt_socket
Use a network socket for debug connections. Other options include Unix sockets and shared memory.
server=y
Listen for incoming debugger connections. When set to n, the process will try to connect to a debugger instead of waiting for incoming connections. Additional arguments are required when this is set to n.
suspend=n
Do not wait for a debug connection at startup. The application will start and run normally until a debugger is attached. When set to y, the process will not start until a debugger is attached.
address=8000
The network port that the JVM will listen for debug connections.
The values above are standard and will work for most use cases and operating systems. The JPDA connection guide covers all possible values in more detail.
3. Spring Boot Applications
Spring Boot applications can be started several ways. The simplest way is from the command line using the java command with -jar option.
To enable debugging, we would simply add the debug argument using the -D option:
java -jar myapp.jar -Dagentlib:jdwp=transport=dt_socket,server=y,suspend=n,address=8000
With Maven, we can use the provided run goal to start our application with debugging enabled:
mvn spring-boot:run -Dagentlib:jdwp=transport=dt_socket,server=y,suspend=n,address=8000
Likewise, with Gradle, we can use the bootRun task. First, we must update the build.gradle file to ensure Gradle passes command line arguments to the JVM:
bootRun {
   systemProperties = System.properties
}
Now we can execute the bootRun task:
gradle bootRun -Dagentlib:jdwp=transport=dt_socket,server=y,suspend=n,address=8000
4. Application Servers
While Spring Boot has become very popular in recent years, traditional application servers are still quite prevalent in modern software architectures. In this section, we’ll look at how to enable debug for some of the more popular applications servers.
Most application servers provide a script for starting and stopping applications. Enabling debug is typically just a matter of adding additional arguments to this script and/or setting additional environment variables.
4.1. Tomcat
The startup script for Tomcat is named catalina.sh (catalina.bat on Windows). To start a Tomcat server with debug enabled we can prepend jpda to the arguments:
catalina.sh jpda start
The default debug arguments will use a network socket listening on port 8000 with suspend=n. These can be changed by setting one or more of the following environment variables: JPDA_TRANSPORT, JPDA_ADDRESS, and JPDA_SUSPEND.
We can also get full control of the debug arguments by setting JPDA_OPTS. When this variable is set, it takes precedence over the other JPDA variables. Thus it must be a complete debug argument for the JVM.
4.2. Wildfly
The startup script for Wildfly is stand-alone.sh. To start a Wildfly server with debug enabled we can add –debug.
The default debug mode uses a network listener on port 8787 with suspend=n. We can override the port by specifying it after the –debug argument.
For more control over the debug argument, we can just add the complete debug arguments to the JAVA_OPTS environment variable.
4.3. Weblogic
The startup script for Weblogic is startWeblogic.sh. To start a Weblogic server with debug enabled we can set the environment variable debugFlag to true.
The default debug mode uses a network listener on port 8453 with suspend=n. We can override the port by setting the DEBUG_PORT environment variable.
For more control over the debug argument, we can just add the complete debug arguments to the JAVA_OPTIONS environment variable.
The latest versions of Weblogic also provide a Maven plugin to start and stop servers. This plugin will honor the same environment variables as the startup script.
4.4. Glassfish
The startup script for Glassfish is asadmin. To start a Glassfish server with debug enabled we have to use –debug:
asadmin start-domain --debug
The default debug mode uses a network listener on port 9009 with suspend=n.
4.5. Jetty
The Jetty application server does not come with a startup script. Instead, Jetty servers are started using the java command.
Thus, enabling debugging is as simple as adding the standard JVM command line arguments.
5. Debugging From an IDE
Now that we have seen how to enable debugging in various application types, let’s look at connecting a debugger.
Every modern IDE offers debugging support. This includes both the ability to start a new process with debugging enabled, as well as the ability to debug an already running process.
5.1. IntelliJ
IntelliJ offers first-class support for Spring and Spring Boot applications. Debugging is as simple as navigating to the class with the main method, right-clicking the triangle icon, and choosing Debug.
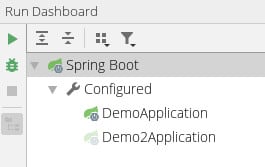
If a project contains multiple Spring Boot applications, IntelliJ will provide a Run Dashboard tool window. This window lets us debug multiple Spring Boot applications from a single place:
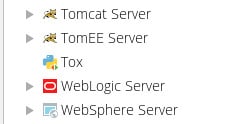
For applications using Tomcat or other web servers, we can create a custom configuration for debugging. Under Run > Edit Configurations, there are a number of templates for most popular application servers:
Finally, IntelliJ makes it very easy to connect to any running process and debug it. As long as the application was started with the proper debug arguments, IntelliJ can connect to it, even if it’s on another host.
On the Run/Debug Configurations screen, the Remote template will let us configure how to attach to the already running application:
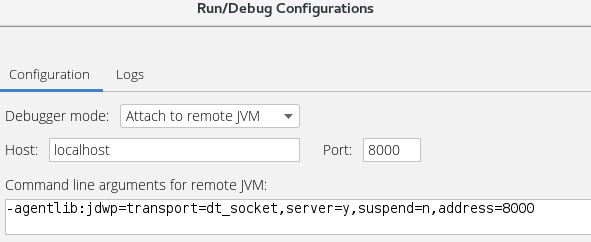
Note that IntelliJ only needs to know the hostname and debug port. As a convenience, it tells us the proper JVM command line arguments which should be used on the application that we want to debug.
5.2. Eclipse
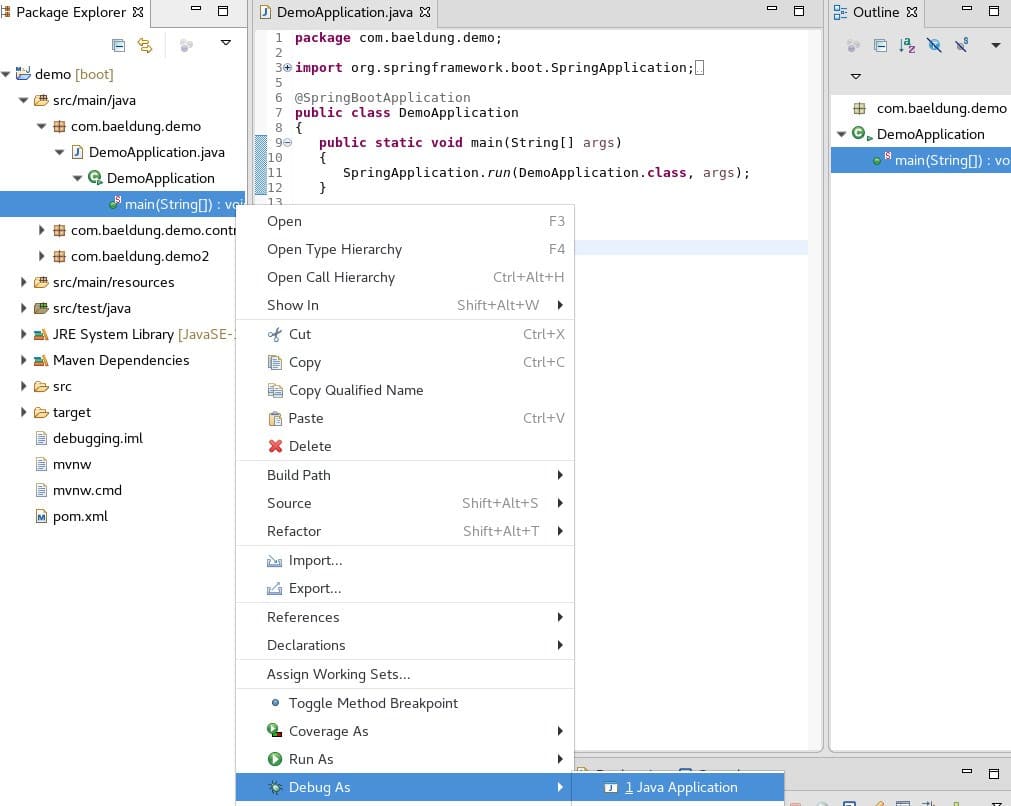
The quickest way to debug a Spring Boot application in Eclipse is to right-click the main method from either the Package Explorer or Outline windows:
The default installation of Eclipse does not support Spring or Spring Boot out of the box. However, there is a Spring Tools add-on available in the Eclipse Marketplace that provides Spring support comparable to IntelliJ.
Most notably the add-on provides a Boot Dashboard that lets us manage multiple Spring Boot applications from a single place:
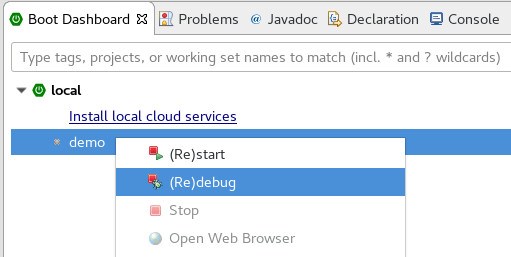
The add-on also provides a Spring Boot Run/Debug Configuration that allows customizing debug of a single Spring Boot application. This customized view is available from all the same places as the standard Java Application configuration.
To debug an already running process, either locally or on a remote host, we can use the Remote Java Application configuration:
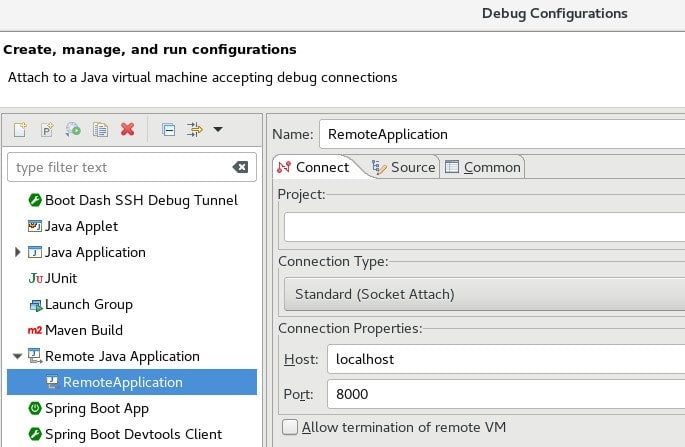
6. Debugging with Docker
Debugging a Spring application inside a Docker container may require additional configuration. If the container is running locally and is not using host network mode, then the debug port will not be accessible outside the container.
There are several ways to expose the debug port in Docker.
We can use –expose with the docker run command:
docker run --expose 8000 mydockerimage
We can also add the EXPOSE directive to the Dockerfile:
EXPOSE 8000
Or if we’re using Docker Compose, we can add it into the YAML:
expose:
 - "8000"
7. Conclusion
In this article, we’ve seen how to enable debugging for any Java application.
By simply adding a single command line argument, we can easily debug any Java application.
We also saw that both Maven and Gradle, as well as most popular IDEs, all have specialized add-ons to make debugging Spring and Spring Boot applications even easier.