1. Overview
New Relic’s Application Performance Monitoring (APM) helps us monitor and analyze the performance of our applications and microservices in one place. It removes the need for separate tools to track different system components, making performance management easier.
The New Relic Java agent constantly monitors our application for performance issues and errors. It sends metrics and event data to the New Relic dashboard at regular intervals, where we can review and improve the application’s performance.
In this tutorial, we’ll discuss several features of the New Relic Java agent, including traces, custom instrumentation, and alerts, that improve our ability to observe and optimize our applications.
2. Setup
We’ll showcase some of the features offered by the New Relic Java agent using a CurrencyConverterService that queries a currency exchange rates API and caches the results in Redis. First, let’s set up a New Relic account.
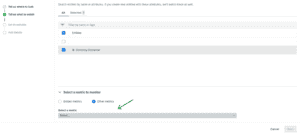
On the sign-up page, we can use our company email address or choose from the available third-party authorization providers. After signing up, we’ll set up the Java agent. New Relic offers two options: a UI-guided launcher or manual installation. For this example, let’s proceed with the manual installation.
We’ll use Apache Maven to download the newrelic-java.zip file, which contains all the Java agent components. Let’s add this dependency to our POM file:
<dependency>
    <groupId>com.newrelic.agent.java</groupId>
    <artifactId>newrelic-java</artifactId>
    <version>8.17.0</version>
    <scope>provided</scope>
    <type>zip</type>
</dependency>
Next, let’s update the POM plugin with instructions to extract the Java agent into the target directory:
<plugin>
    <groupId>org.apache.maven.plugins</groupId>
    <artifactId>maven-dependency-plugin</artifactId>
    <version>3.1.1</version>
    <executions>
        <execution>
            <id>unpack-newrelic</id>
            <phase>package</phase>
            <goals>
                <goal>unpack-dependencies</goal>
            </goals>
            <configuration>
                <includeGroupIds>com.newrelic.agent.java</includeGroupIds>
                <includeArtifactIds>newrelic-java</includeArtifactIds>
                <excludes>**/newrelic.yml</excludes>
                <overWriteReleases>false</overWriteReleases>
                <overWriteSnapshots>false</overWriteSnapshots>
                <overWriteIfNewer>true</overWriteIfNewer>
                <outputDirectory>${project.build.directory}</outputDirectory>
            </configuration>
        </execution>
    </executions>
</plugin>
The plugin extracts the agent’s components into the newrelic folder in the root directory of our project. We configure the plugin to exclude the newrelic.yml file to prevent it from being overwritten each time Maven re-extracts the agent.
Next, we configure the newrelic.yml file with custom settings for the New Relic agent. To do this, let’s download a template of the file and edit it with our configurations:
curl -L -o /path/to/extracted/agent/newrelic/newrelic.yml https://download.newrelic.com/newrelic/java-agent/newrelic-agent/8.17.0/newrelic.ymlAs recommended, let’s change the default newrelic.yml permissions to allow read and write access only for the owner of the application process. On a Linux system, we use the following command:
chmod 600 newrelic.ymlNext, let’s edit the configuration values:
common: &default_settings
  license_key: <LICENSE_KEY>
  agent_enabled: true
  app_name: Currency Converter
  #...
development:
  <<: *default_settings
  app_name: Currency Converter (Development)
test:
  <<: *default_settings
  app_name: Currency Converter (Test)
production:
  <<: *default_settings
staging:
  <<: *default_settings
  app_name: Currency Converter (Staging)
Our license_key was issued when we created our New Relic account. Next, let’s test our setup by starting the application:
java -javaagent:/path/to/newrelic.jar -jar /path/to/currency-converter-0.0.1.jarAfter a short while, we should see our service listed under one.newrelic.com -> APM & Services.
3. Tracing Requests
Like other APM (Application Performance Monitoring) tools, New Relic lets us visually track the journey of a request. Let’s issue a request to our service to see this feature in action:
curl --request GET \
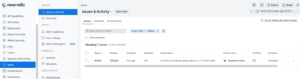
--url 'http://localhost:8080/api/currency/convert?targetCurrency=GBP&amount=100'Next, let’s navigate to the New Relic admin portal -> Traces and select our trace from the list. We should see a flow similar to the one in the screenshot below:
Our request looked up the Redis cache, encountered a cache miss, called the currency exchange rates API, and stored the results in the Redis cache.
4. Implementing Custom Instrumentation
Although the Java agent automatically produces useful performance data, it also lets us add more detail to our transaction traces through the Java agent API. Let’s add it as a dependency to our project:
<dependency>
    <groupId>com.newrelic.agent.java</groupId>
    <artifactId>newrelic-api</artifactId>
    <version>8.17.0</version>
    <scope>runtime</scope>
</dependency>
Next, let’s update our service code to use the agent API:
@Service
public class CurrencyConverterService {
    //...
    @Value("${openexchangerates.base_currency}")
    public String baseCurrency;
    @Trace(metricName="CurrencyConversionCalc")
    public double getConvertedAmount(String targetCurrency, double amount) {
        String cacheKey = baseCurrency + "-" + targetCurrency;
        //...
        String eTagHeaderField = response.header("ETag");
        NewRelic.addCustomParameter(cacheKey, eTagHeaderField);
        //...
    }
}
The @Trace annotation instructs the Java agent to measure the getConvertedAmount() method, and the metricName property assigns a name to the metrics captured for our method in a transaction trace. We can manually capture a custom parameter returned as a header from the currency exchange rates API call.
Next, let’s enable custom tracing in the newrelic.yml file:
common: &default_settings
  #...
  enable_custom_tracing: true
By rerunning our application, we’ll see the additional information:
We use custom attributes when we want to run specific queries on our data. Let’s draft a query that uses the parameter we just created as an example:
SELECT count(`USD-AUD`) FROM `Transaction` SINCE 24 hours ago UNTIL now TIMESERIESThis query generates a time series similar to the one below:
[
    {
        "metadata": {
            "timeSeries": {
                "messages": [],
                "contents": [
                    {
                        "function": "count",
                        "attribute": "USD-AUD",
                        "simple": true
                    }
                ]
            },
            "eventTypes": [
                "Transaction"
            ],
            "eventType": "Transaction",
            "messages": [],
            "rawSince": "24 HOURS AGO",
            "rawUntil": "NOW",
            "rawCompareWith": ""
        },
        "total": {
            "results": [
                {
                    "count": 1
                }
            ],
            "beginTimeSeconds": 1736759267,
            "endTimeSeconds": 1736845667
        }
    }
]
From the time series, we note that our service was called only once during the 24-hour period being queried.
5. Configuring Alerts
Another helpful feature of New Relic is its Alerts, which let us configure early warnings to notify us of issues or anomalies in our application’s performance or activity. We configure these alerts in the New Relic admin portal using a range of available metrics. Let’s configure our own metric to use for an alert condition:
//...
Double cachedRate = redisTemplate.opsForValue().get(cacheKey);
if (cachedRate != null) {
    logger.info("Cache hit for key: {}", cacheKey);
    return amount * cachedRate;
} else {
    logger.info("Cache miss for key: {}, fetching from API", cacheKey);
    NewRelic.incrementCounter("Custom/CacheMisses");
}
//...
Each time we encounter a cache miss, we increment the metric counter associated with the provided metricTimesliceName. Next, we configure a condition to monitor this metric.
Let’s navigate to the New Relic admin portal -> Alerts -> Alert Conditions and select ‘New alert condition‘. From there, we’ll use the recommended guided mode to create our condition. Our metricTimesliceName will appear under Services – APM -> ENTITY_NAME -> Other Metrics only after the Java agent collects the metric from our running application.
We’ll use the guided mode to create an Alert Policy, which groups our alert conditions and links them to a Workflow with customized alert notifications. After making a few requests on our application that trigger the condition, the Alert Policy will trigger an alert and the associated workflow:
6. Conclusion
In this article, we explored New Relic Java agent features and how they can enhance the observability of our applications. We saw how traces help track requests in our system, how to enrich our telemetry with custom instrumentation, and how to configure early warning notifications.
As always, the code is available over on GitHub.
The post Introduction to New Relic for Java first appeared on Baeldung.


